
Data Visualization in Biomedical Research with Bionl.ai

Introduction
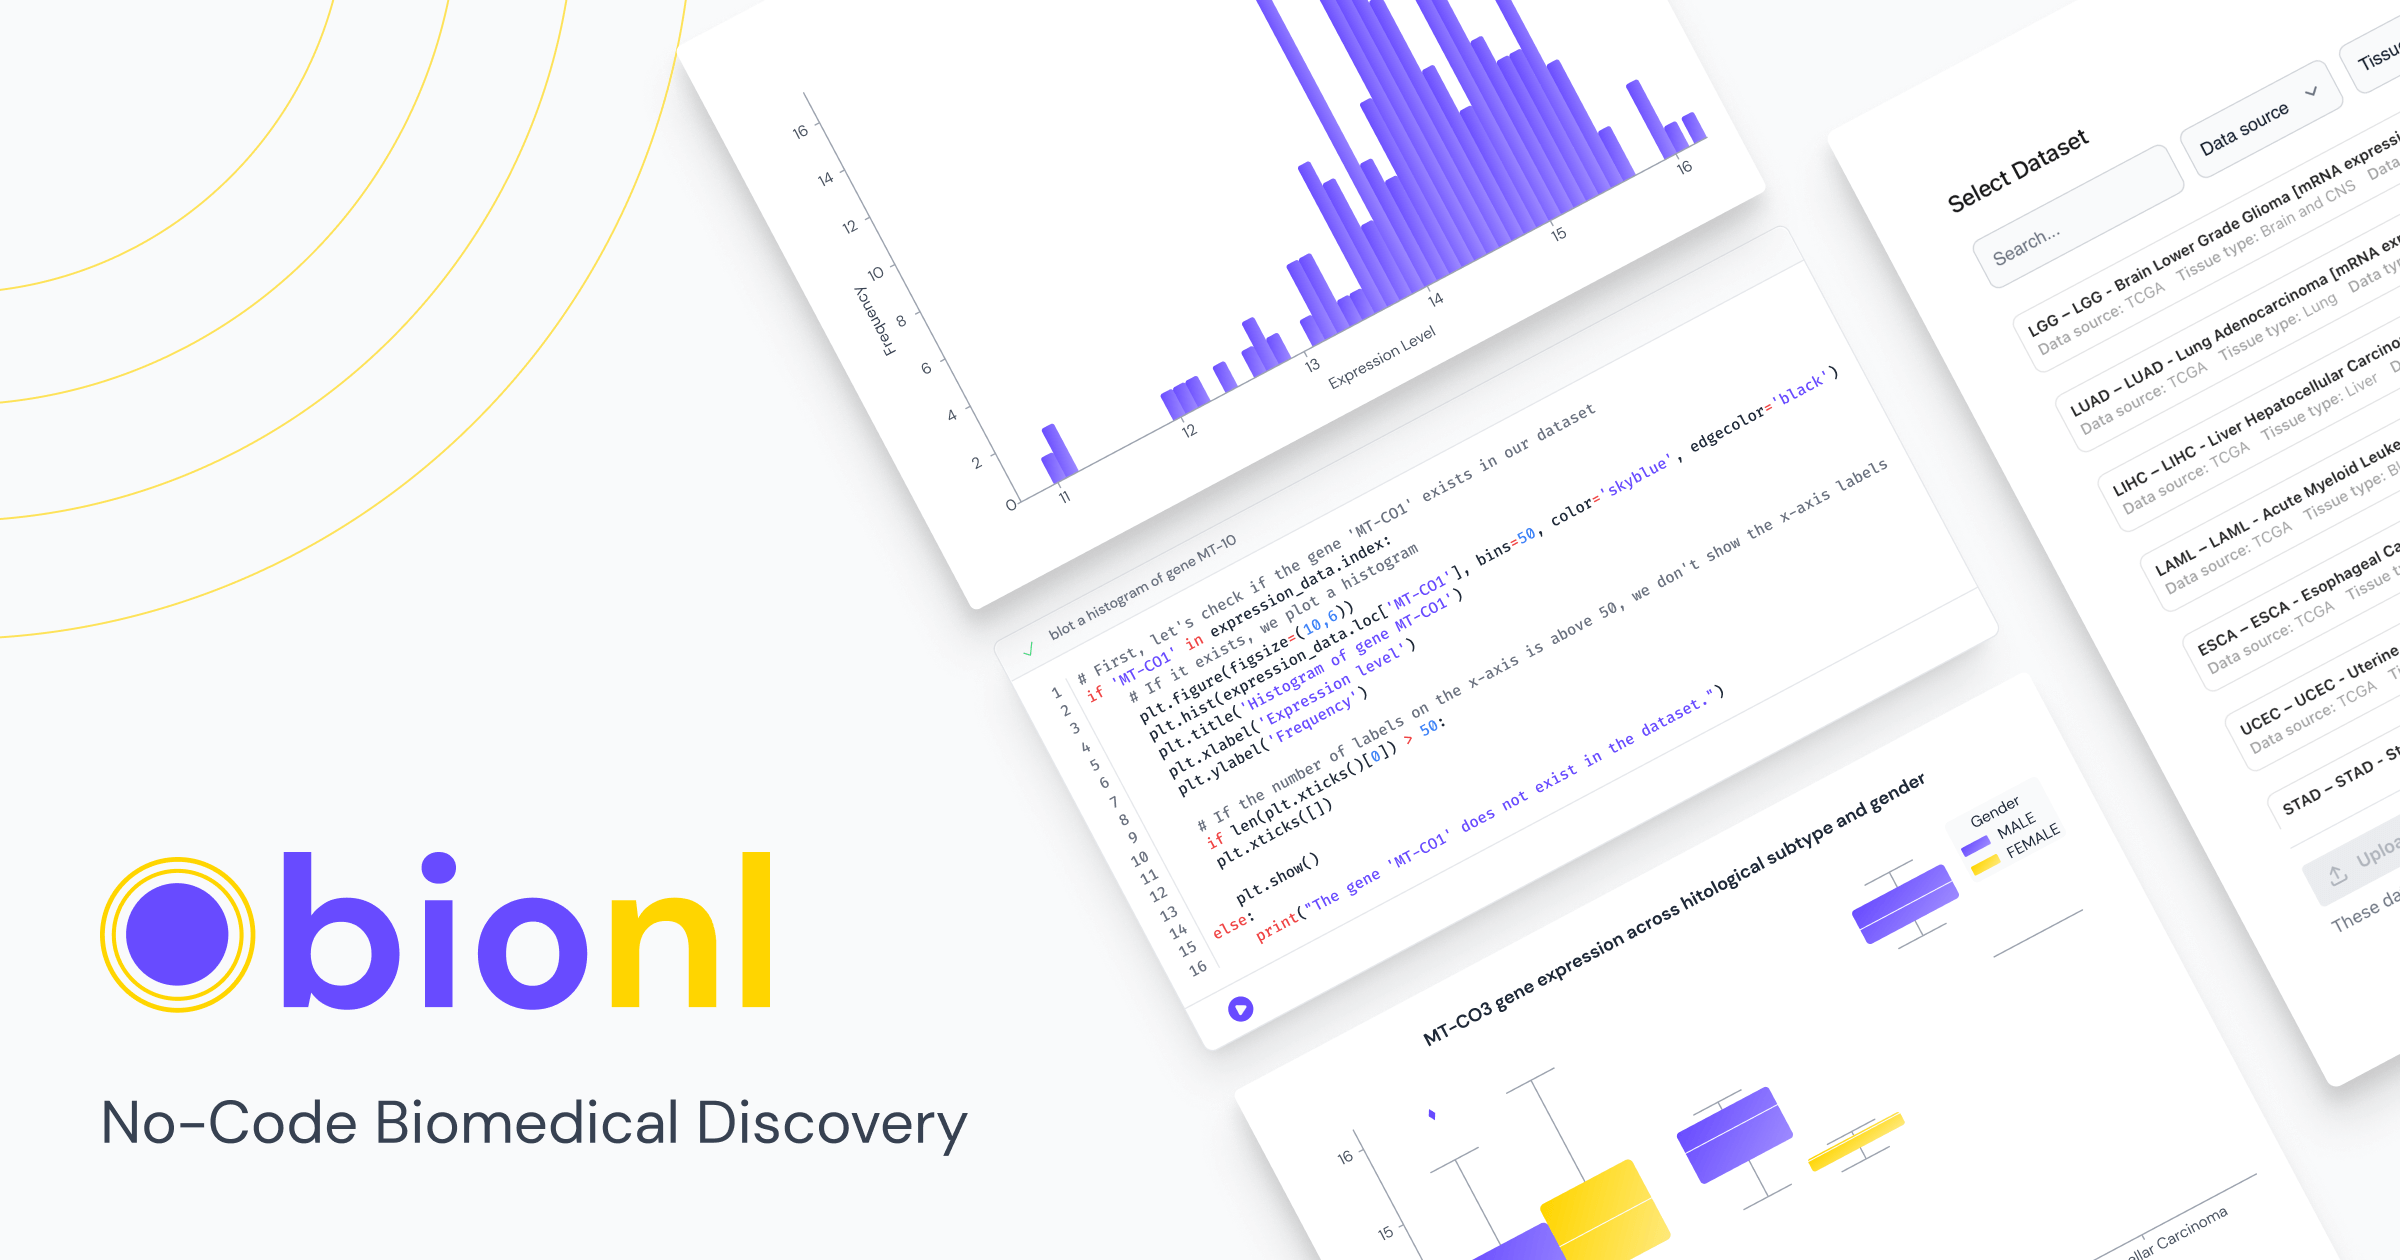
In the age of big data, the ability to visualize complex datasets is more crucial than ever. Data visualization is the art and science of translating raw data into graphical representations such as charts, graphs, and maps. This is particularly important in fields like biomedical research and bioinformatics, where Bionl.ai is making strides by offering intuitive, no-code platform with data visualization tools.
Why Data Visualization Matters
Data visualization serves multiple purposes, especially in a complex field like biomedical research:
- Simplifying Complexity: Biomedical data can be overwhelmingly intricate. Data visualization helps break down this complexity into digestible, understandable pieces. Bionl.ai's platform excels at this, allowing researchers to easily interpret genomic data, for instance.
- Identifying Patterns and Trends: Visualizing data can reveal patterns and trends that might be invisible in a spreadsheet. For example, Bionl.ai's GenAI for Data Analysis can help researchers spot trends in gene expression over time.
- Enhanced Communication: A well-designed visualization can communicate complex biomedical findings in a way that is accessible even to non-experts. Bionl.ai's visualization tools are designed to be user-friendly, making it easier for scientists to share their findings with a broader audience.
- Informed Decision-Making: Whether it's choosing a research direction or making clinical decisions, visualized data can guide the way.
Types of Data Visualization in Bionl.ai
Different types of visualization is present, depending on the data type. Bionl.ai offers a range of options tailored to the needs of biomedical researchers:
1. Charts: From bar charts for gene frequency distribution to line charts for tracking protein interactions over time, charts are versatile and easy to interpret.
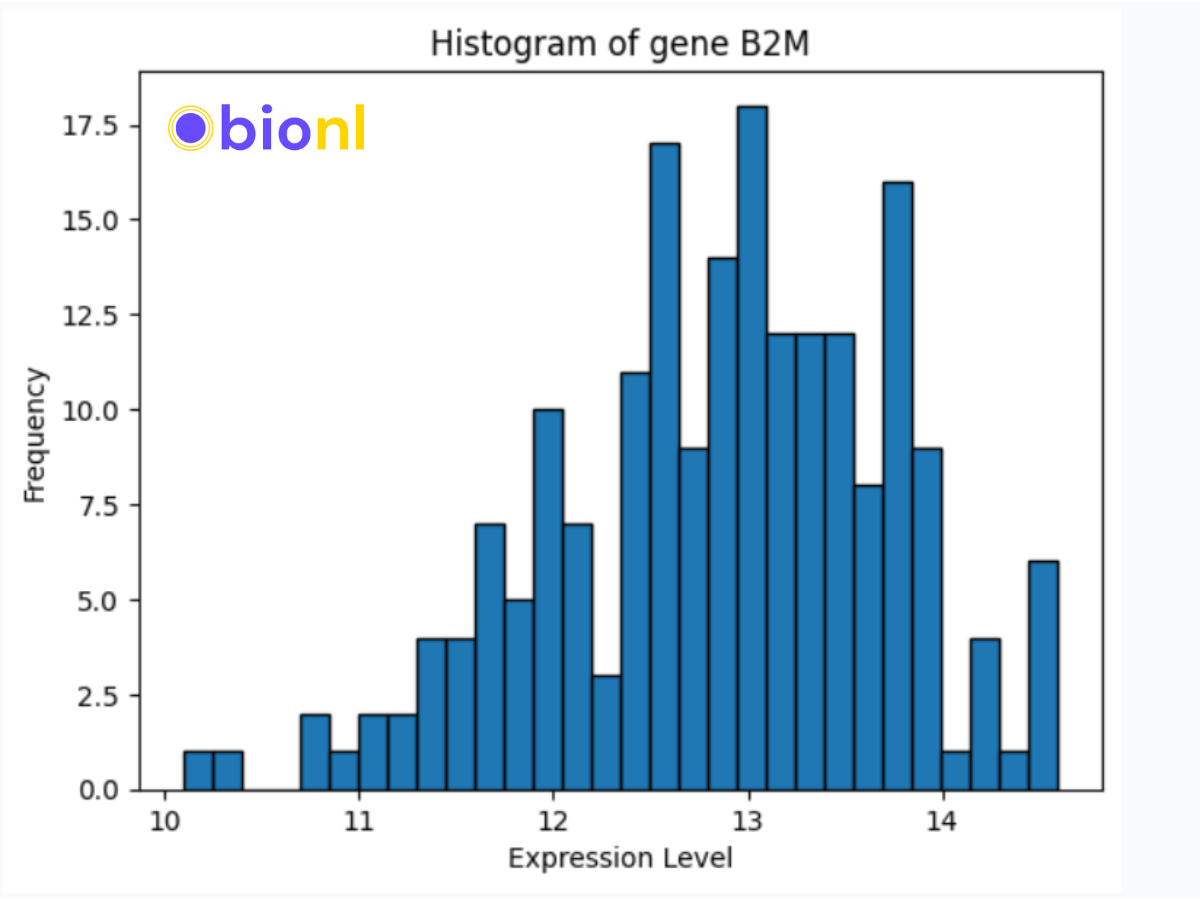
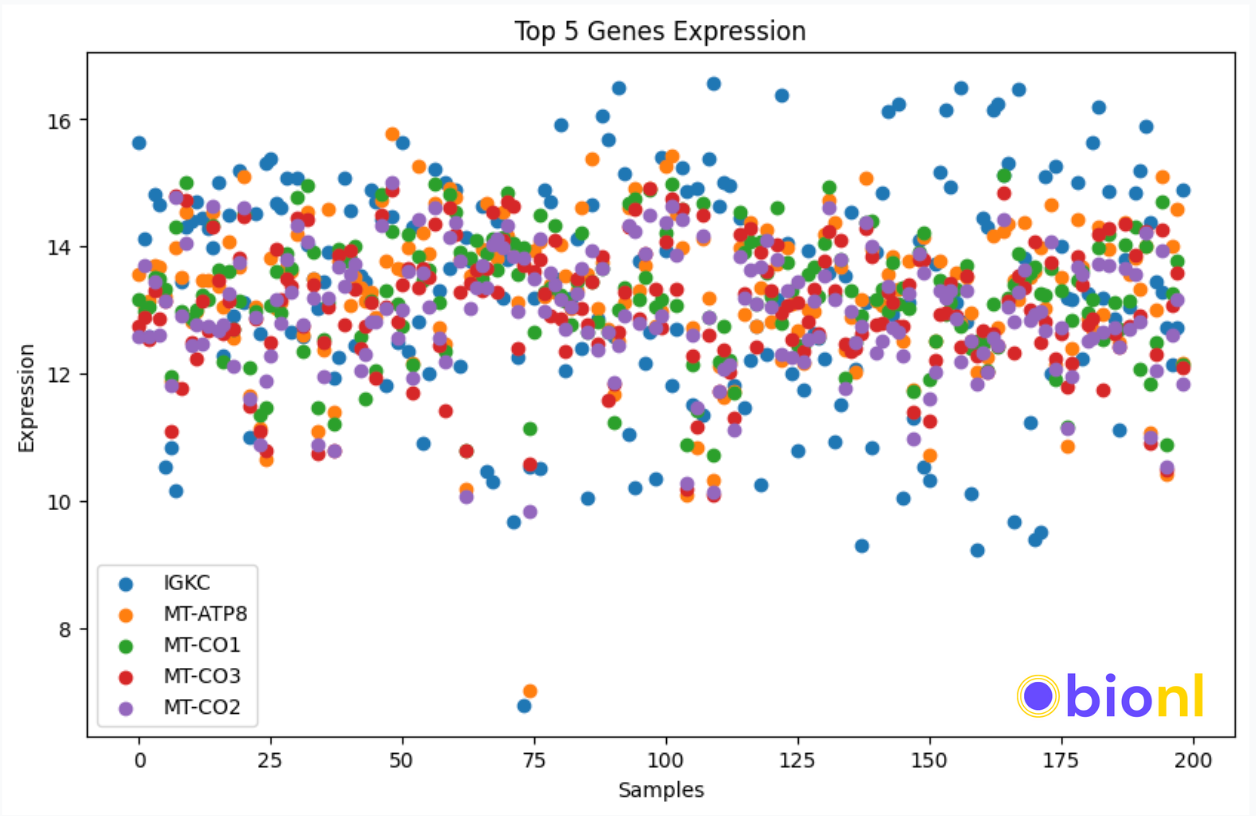
2. Graphs: Scatter plots for gene expression levels or histograms for patient outcomes, graphs can show relationships and distributions effectively.
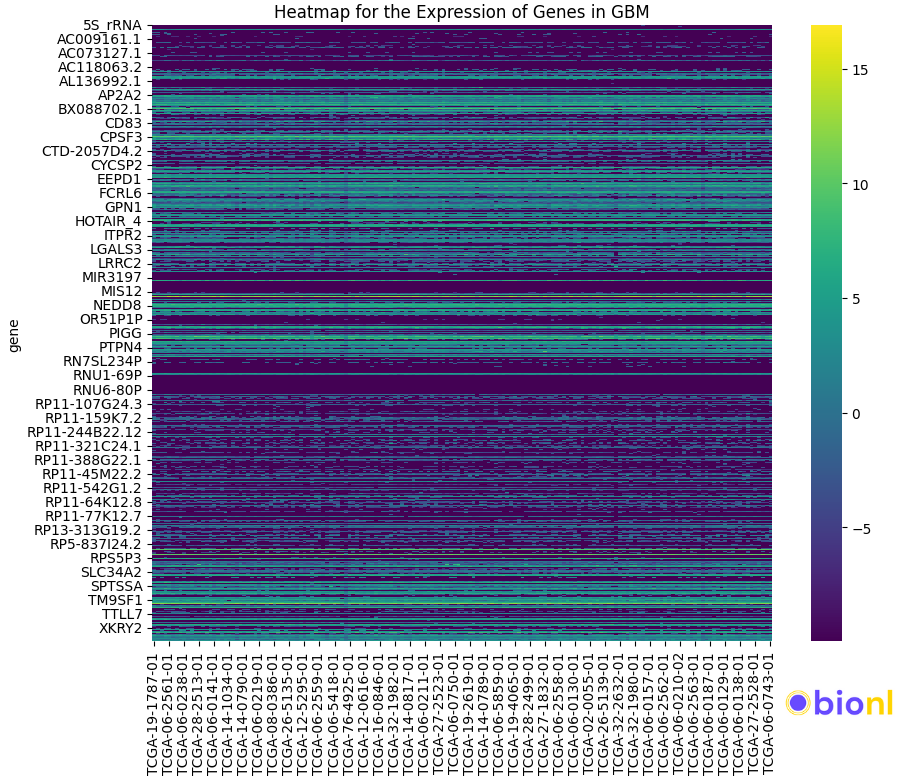
3. Maps: In the context of biomedical research, heatmaps can be invaluable. Bionl.ai allows for the creation of heatmaps to represent, for example, the expression levels of thousands of genes across different conditions.
Choosing the Right Visualization with Bionl.ai
Selecting the appropriate visualization depends on several factors:
- Type of Data: Bionl.ai's platform can guide you in selecting the most suitable visualization based on the data you have. For instance, if you're looking to compare gene expressions in different tissues, a bar chart might be most effective.
- Audience: Bionl.ai's user-friendly interface makes it accessible even for those without a background in data science or bioinformatics, allowing you to tailor your visualizations to the expertise level of your audience.
- Purpose: Are you trying to identify a trend in a sequence of DNA, or are you comparing protein levels in different patient samples? Knowing your objective can help you choose the right visualization tool on Bionl.ai's platform.
Conclusion
Data visualization is not just an aesthetic endeavor; it's a powerful means of understanding and communicating complex information. In the realm of biomedical research, where data can be as intricate as it is crucial, platforms like Bionl.ai are revolutionizing the way we interact with information. By offering a range of visualization tools that are both powerful and user-friendly, Bionl is empowering researchers to derive more value from their data, communicate more effectively, and make better-informed decisions.
This blog was co-authored with ChatGPT.